
The airport authority for Centennial Airport (KAPA) does the right thing when they share monthly fuel flow data; good for them, and hopefully other airports will be responsible with this level of transparency. The latest release includes June data, and past releases offer 150 months of data.
The KAPA data reflects a reality at most U.S. general aviation (GA) airports: a major revenue source is the fuel flowage fee. Airports are expected to secure their own revenue as seed money for federal grants, which traditionally have been very generous, securing grant monies at 95:5 or 90:10 ratios (i.e., many projects require the airport authority provide $50,000 of their own money to secure $950,000 in federal funding). All of this is within the Airport Improvement Program (AIP), legislated by Congress. AIP grants include a long list of ‘grant obligations’ that effectively destroy local control and protect these GA airports FOR aviation interests and AGAINST local residents (as well as local leaders) of the local community. Over time, these GA airports become something of an occupying force; the airport is there, surrounded by the local community, but its operation is effectively controlled by a distant landlord (FAA, in DC), in concert with the elite interests of lobbyist groups like AOPA, NBAA, EAA, GAMA, and others.
This is also part of why, at all airports, FAA insists that ALL revenues from leased land and buildings – even when the lease is a big box store or supermarket or office with NOTHING to do with the airport – well, all of that revenue has to go back into the airport, cannot be used to support the local human community. But that’s just another long overdue reform we need from Congress….
The Original Data
The original KAPA data is provided in a simple, black-and-white table of ‘fuel flowage data’. As background, understand the ‘fuel flowage fee’ is assessed for each gallon of fuel that flows at the airport.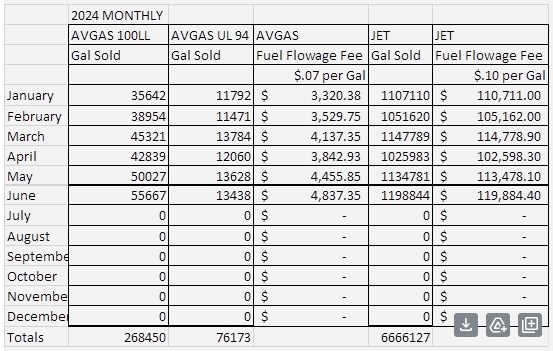 It is assessed for operators who sell fuel (just like regular gas stations), but also for operators who are refilling their own tanks (for their flight school planes, air charter service, corporate/personal fleet, etc.).
In its original format, the tables lay out for each month, how many gallons of each type of fuel was ‘flowed’. The two primary fuel types are ‘100LL’ leaded avgas aviation fuel, and ‘jetfuel’. A third fuel type was started in May 2023, when ‘94UL’ unleaded avgas was first offered by one of the operators leasing facilities at KAPA.
Making the Data More Readable
Click here to view, and click here for PDF download (1p).
There are simple modifications that make this data far more readable. For example, we might create a total for each calendar year, simply adding up the twelve months. We might also create an average for each month, through the 12+ year dataset; These are added in a line just under the header row. Averages help to reveal the seasonality of fuel sales – which month is heaviest, which month is lightest, is the pattern consistent year to year, or is the pattern changing due to new flight schools or other operators, etc. The average also provides a handy means of comparison for each month, to help clearly reveal month to month trends of growth or decline. In this example, a red-green color-scale has been added. Red-green is used, with red implying higher impact on the community (noise and lead pollution), green implying lesser impact. The red darkens for monthly values to 20% above the average, and green darkens for monthly values to 20% below the average.
An Even Better Way to View the Data: Running-Sum Annual Totals
Click here to view, and click here for PDF download (2p).
With a little effort, the original KAPA data can be worked into a spreadsheet and better metrics defined. The ‘12-month running sum’ is one such metric. It is a simple total, each month, for the twelve most recent months. A 12-month running sum enables us to see true peaks, no longer limited to just the peak at the end of each calendar year. It also enables us to see how we are doing this month, relative to the start of the year, to better project if the current ongoing year is one of growth or decline.
Another good metric is the ‘year-to-year change’. This metric compares the 12-month running sum and presents a percentage change for the current month versus 12-months ago. For this KAPA data, the June 2024 21-month running sum avgas fuel flowage is 12% higher than it was in June 2023 (747,645 gallons versus 666,836 gallons).
A third metric is the gray column at far-right. It shows a comparison of the 12-month running sum versus the overall average 12-month running sum.
- For jetfuel, there is a long, steady climb from 82% at the end of 2012 to a level-off around 103% at the end of 2018. This level-off runs 15-months, never exceeding 104% up to the start of the pandemic, at which time jetfuel volumes drop rapidly, bottoming out at 87%. Starting with March 2021, jetfuel volumes rapidly climb to 129% in summer 2022, only to start a steady downward trend at the end of 2022. In the last two full years, jetfuel volumes have dropped 18%, and as of now volumes are 105% of the 12-year average. The recent trend is positive for reducing impacts.
- For Avgas, this trends at 97% at the end of 2012, peaks at 103% in 2014, declines to 85% in early 2017, peaks again at 103% in late 2018, waffles for a year before peaking again at 104% just ahead of the pandemic, then waffles through the pandemic (very slight declines); post-pandemic, a steady climb to a 105% peak in 2022, a leveling, then another steadier (and steeper) climb to the current 119% peak. The recent trend is negative, showing increasing impacts.
Color-scales are also added to two of the columns. A red-blue (heat-up vs cool-down) scale is overlaid onto the 12-month running sums data; red darkens as the 12-month running sum approaches +20%, and blue darkens as the 12-month running sum approaches -20%. A second color-scale is orange-green, applied to the year-to-year change data column; orange darkens as the annual rate of change approaches +20%, and green darkens as the annual rate of change approaches -20%.
What Does this Latest Data Show, in the Improved Format?
Aside from points noted above, some other interesting points:
- It appears that jetfuel volumes became inflated by post-pandemic, pent-up flying demand (for personal/corporate jets, air charters, etc.), a demand that has already been sated.
- As a rule of thumb, at KAPA, jetfuel volumes are consistently 19-times Avgas volumes; i.e., for each 5 gallons of Avgas flowed, there are 95 gallons of jetfuel flowed.
- Avgas volumes show strong fluctuations. They appear to be not so much a function of pilot activity as they are pinned to whether the airport authority ends or starts a lease to yet another flight school.
- Keep in mind, much of these fuel volumes are fuel sales within a broader market. Pilots tend to be like car owners, selective about where they refuel, searching for lowest prices. Fuel pricing is readily available online, and pilots use this data to plan added fuel stops, if advantageous, along their trips. Dozens of Front Range airports are at play. A huge number of GA trips are hobby and recreational, and these pilots can easily flex their plans. On top of that, fuel prices vary greatly from one airport to the next. Most airports offer monopoly or duopoly fuel sales, at the most, so it is easy for prices to be fixed higher … and neither FAA nor state or local airport authorities seem to care.
Two Closing Points
- Lead pollution is a huge problem for Avgas. The world has been trying to remove lead pollution for more than fifty years. But, in the U.S., aviation lobbyists, in concert with FAA (which consistently serves aviation interests AGAINST the interests of impacted people), continue to play out a delay game, extending exemptions that have made GA the biggest lead pollution over recent decades. We cleaned up fuel for cars, and we reworked key industries (paint, glass, etc.) to reduce or eliminate lead emissions, and yet hobby and recreational pilots do their thing while endangering the other 99.9% of the population who are not GA pilots.
- Local airports should serve the local community, ahead of elite (and often non-local) aviation interests. This is best accomplished by starting with data transparency. Airport authorities need to advocate, and FAA leadership needs to join that advocacy, with all parties asking Congress to legislate data transparency requirements. Congress can require that each airport with federal airport grant monies is obligated to share monthly data, either via a website or reported to FAA for the federal regulator to post online. Not just for monthly fuel volume reports, but also for operational figures, based aircraft figures, etc. The local community – not just homeowners and residents, but also the leaders and elected officials – should have the tools to know definitively how the airport impacts their community. Data that is relevant, thorough, and timely enables meaningful citizen engagement, and can ultimately help ensure the airport serves the community, first … as it should.